
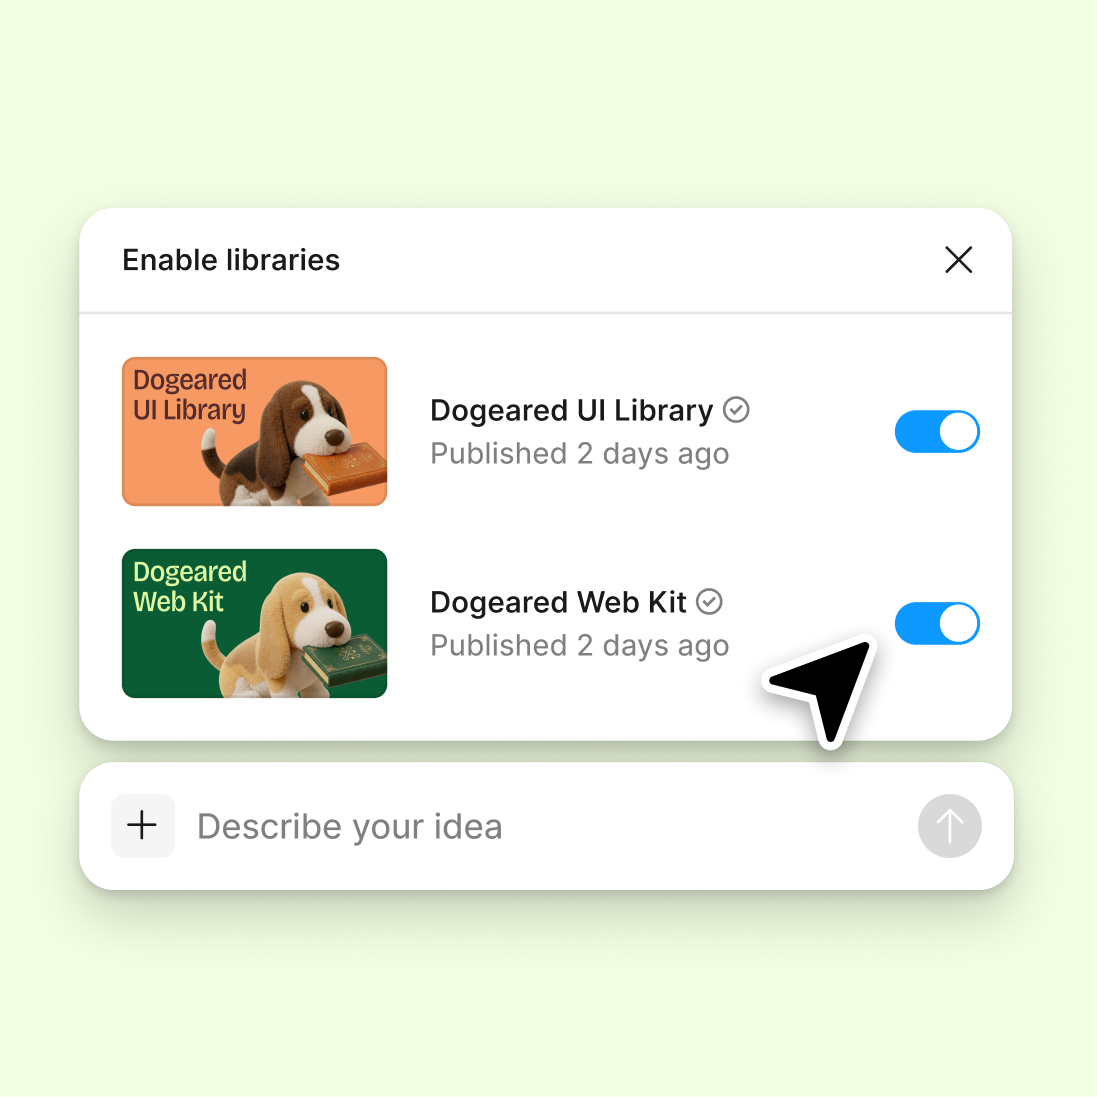
Connect a design library
Generate charts that pull from your existing color tokens, type styles, and component patterns—so every visualization feels native to your design system.
Skip to main content
Drop your spreadsheet into Figma Design and let the agent generate editable charts and graphs—directly on your canvas. No switching to a separate tool, no rebuilding visuals by hand.


Figma's agent transforms raw CSV data into polished, editable charts right on your canvas—keeping your data visualizations in sync with the rest of your design work.

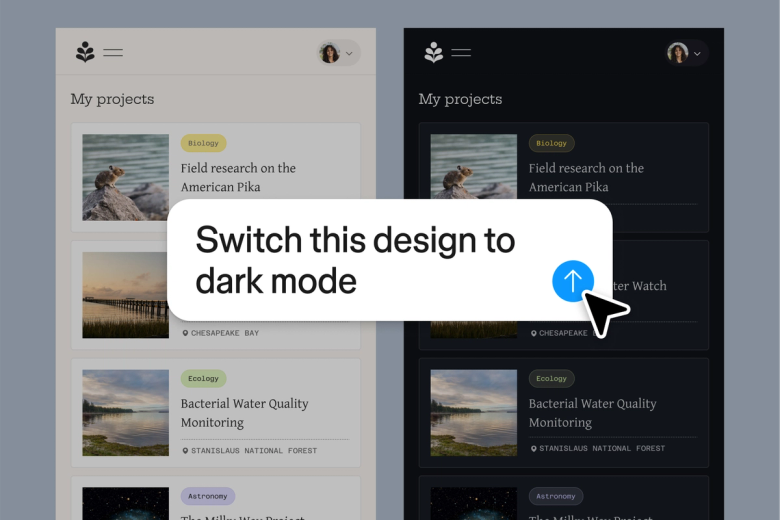
Figma's agent reads your CSV and builds actual chart components on the canvas—bar charts, line graphs, pie charts—using your design system's styles and colors, so they match your work from the start.

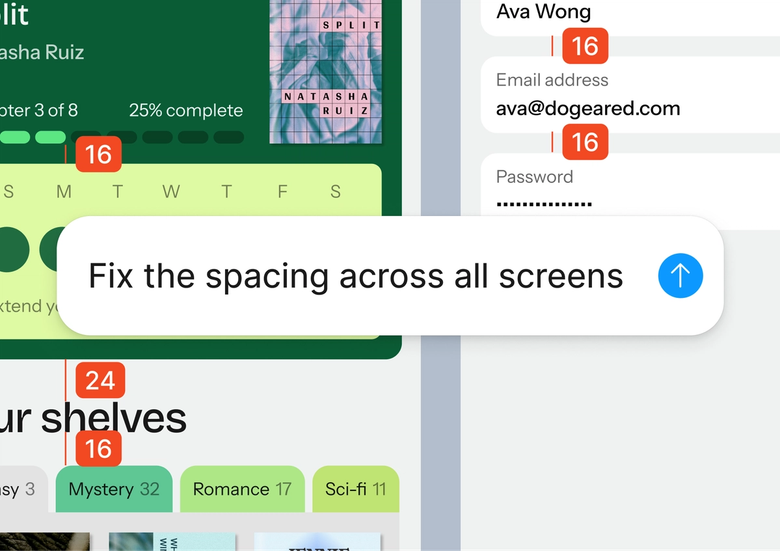
Skip the export-import dance between spreadsheet tools and design files. Describe the chart you need, point to your data, and the agent handles the visual translation while you focus on the story you're telling.

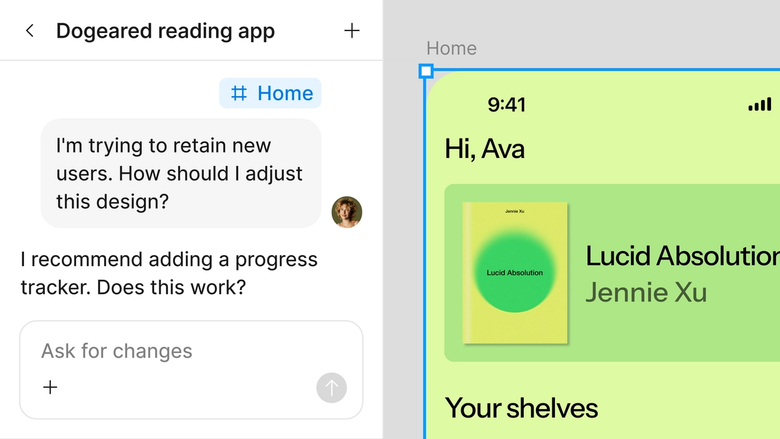
Charts generate in the same file your team works in, so stakeholders see the latest visualization and can comment, iterate, or build on it immediately. Nothing gets lost in a handoff.
A closer look at what sets Figma's agent apart, built for the way design teams actually work.
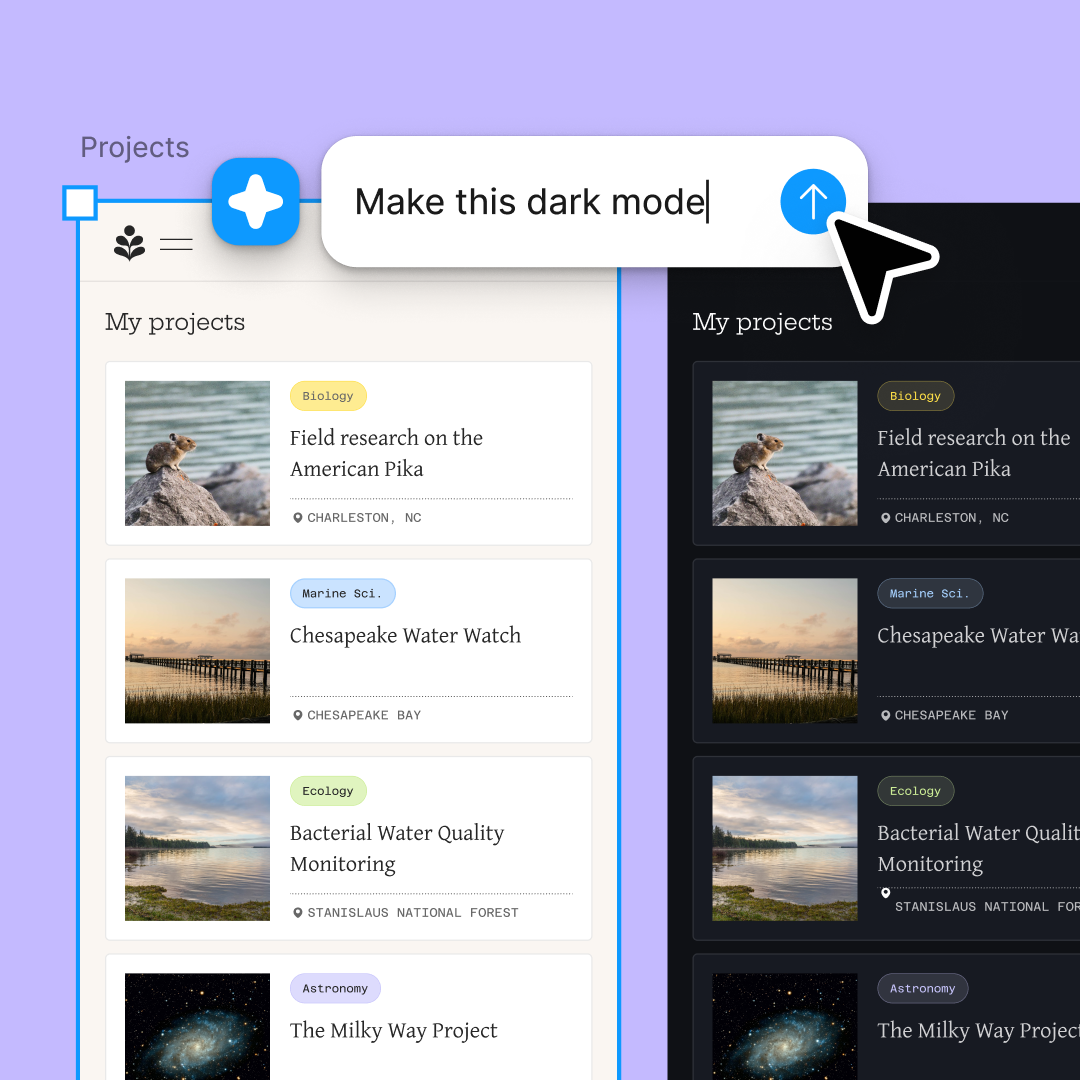
Generate charts that pull from your existing color tokens, type styles, and component patterns—so every visualization feels native to your design system.

Explore multiple chart types at once—bar, line, and pie—to see which visualization tells the clearest story, without waiting on each one sequentially.

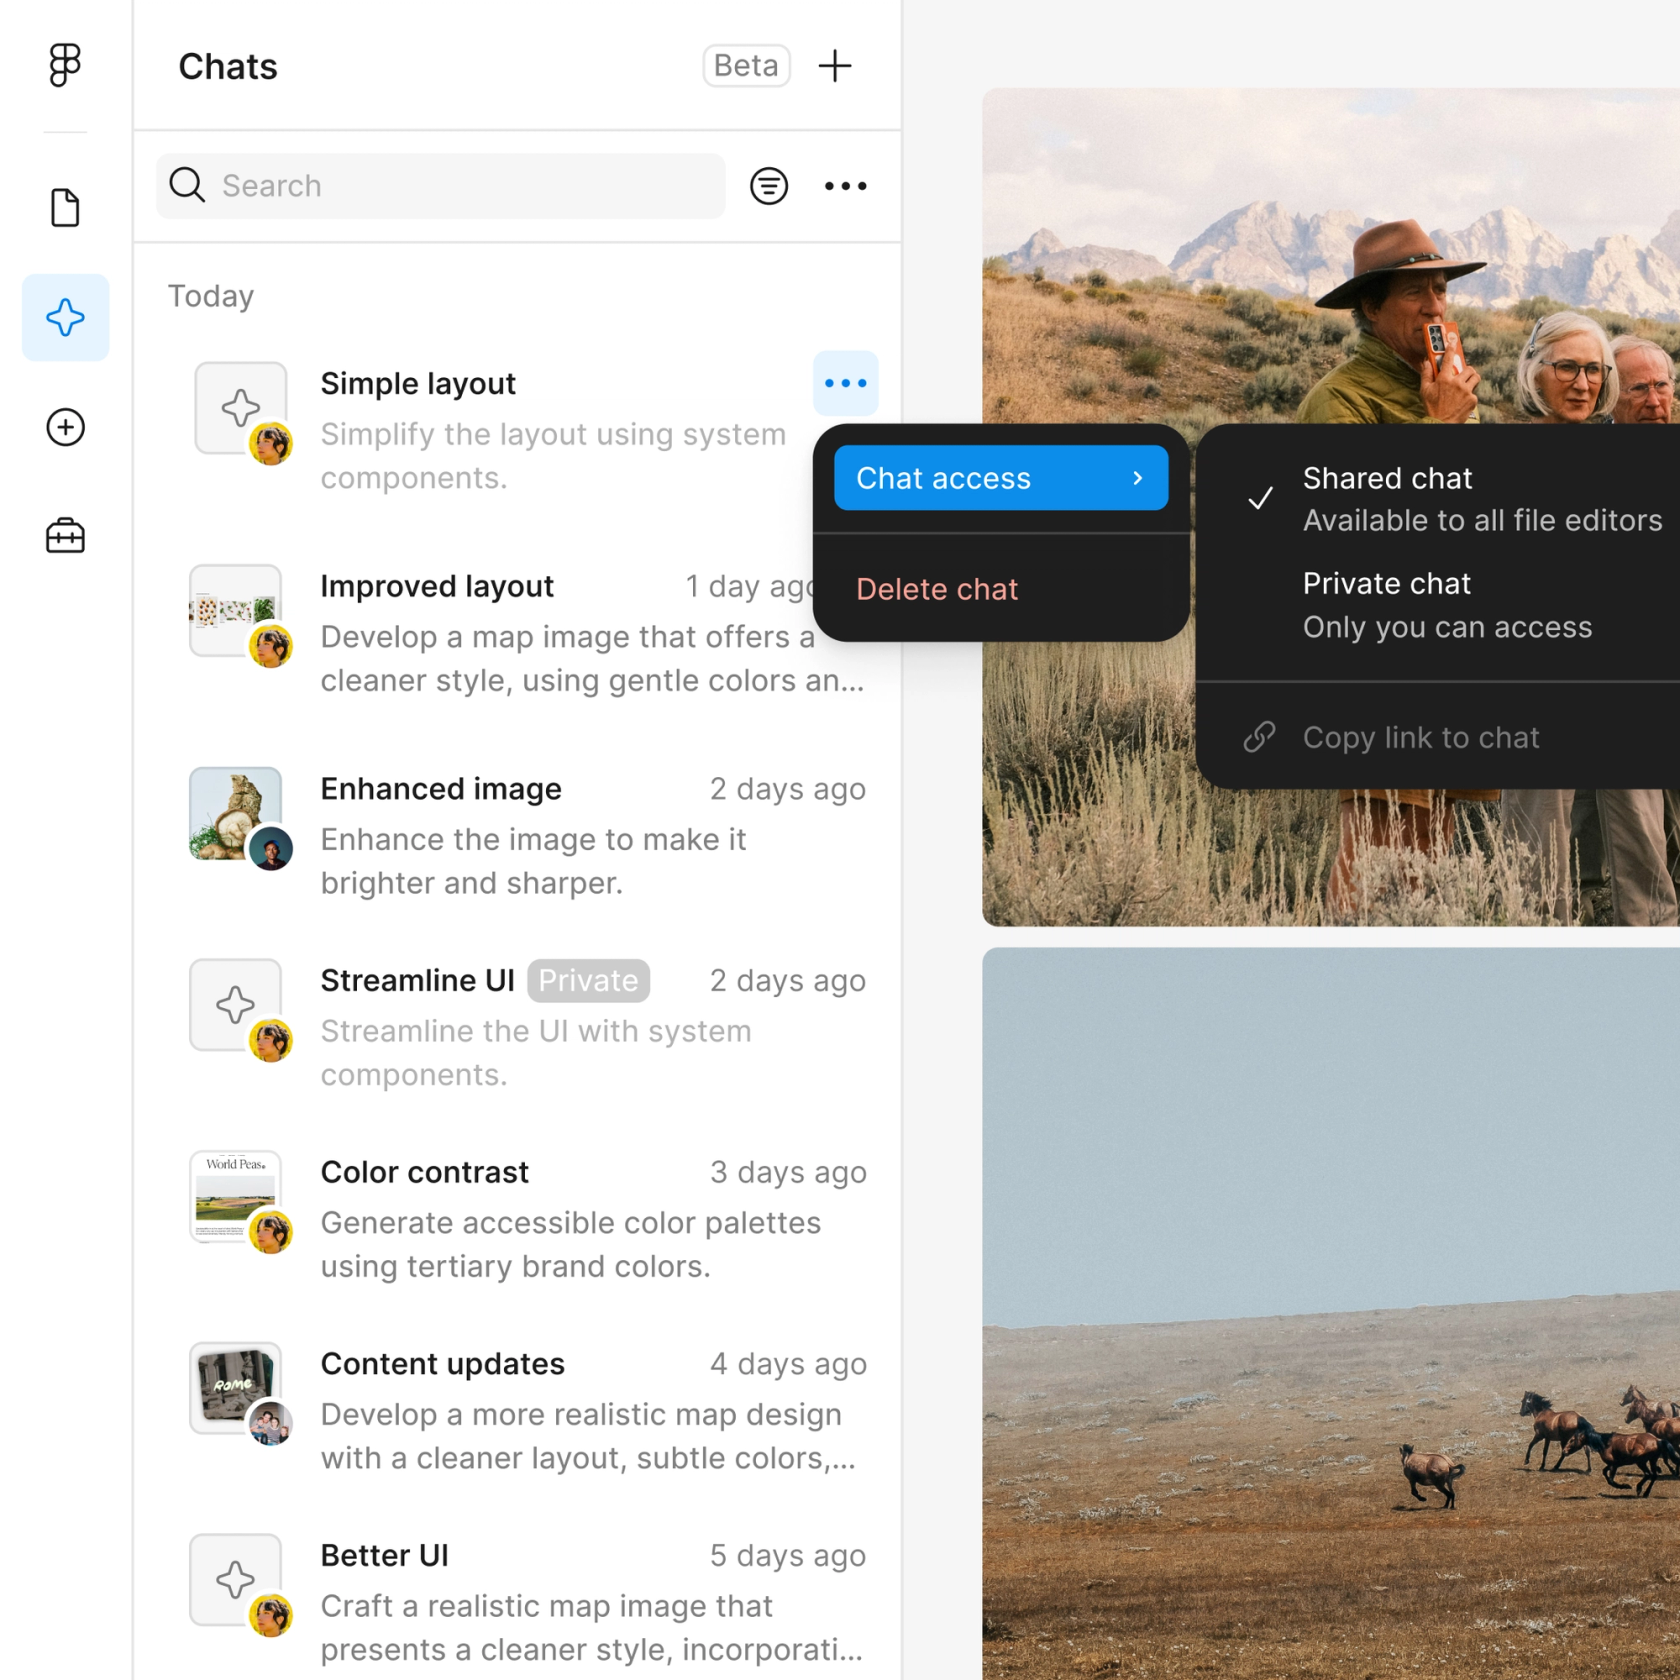
Share your chart thread and teammates see the full prompt, data source, and iteration history. No separate documentation needed.

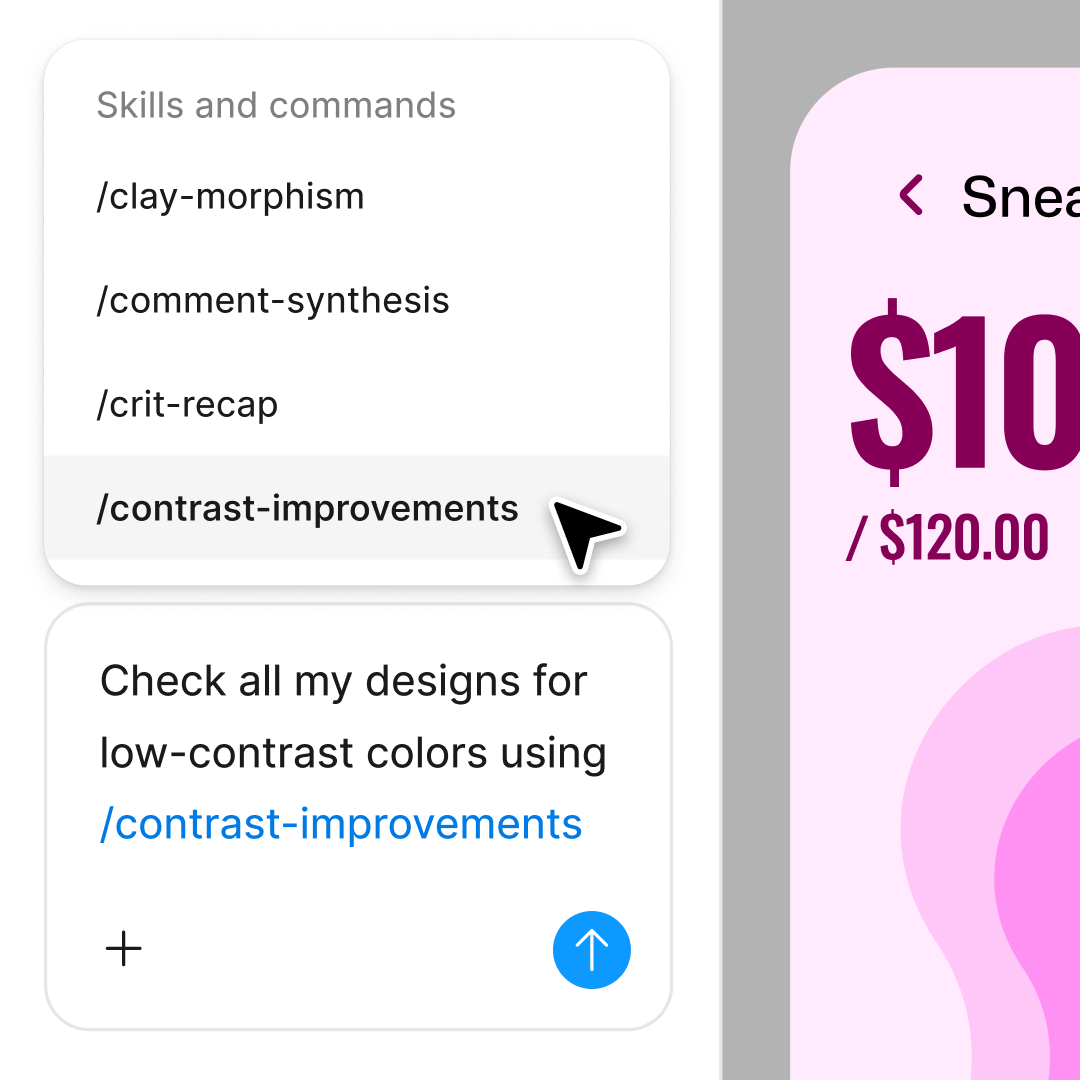
Adjust axis labels, swap chart types, or change the color scheme in the same thread—or branch into a parallel one to try a different direction.
Figma feels like a natural extension of my hand. I do my design ideation on the canvas, and now the agent takes it the last mile. With my design libraries connected, I can move from design to code faster than ever before.
Andy Madrick
Product Designer, Notion

Drop your CSV file onto the canvas in Figma Design, or paste the data directly into your prompt.
Tell the agent what type of visualization you want—bar chart, line graph, pie chart—and which columns to use. Reference your design library for consistent styling.
Check the generated chart on your canvas. Refine labels, colors, or chart type in the same thread, or start a parallel one to explore alternatives.
Everything stays editable as native Figma layers. Adjust by hand, update the data, or prompt again until the visualization is exactly right.
Watch Figma's AI Agent in action and see how to put it to work in your own workflows.

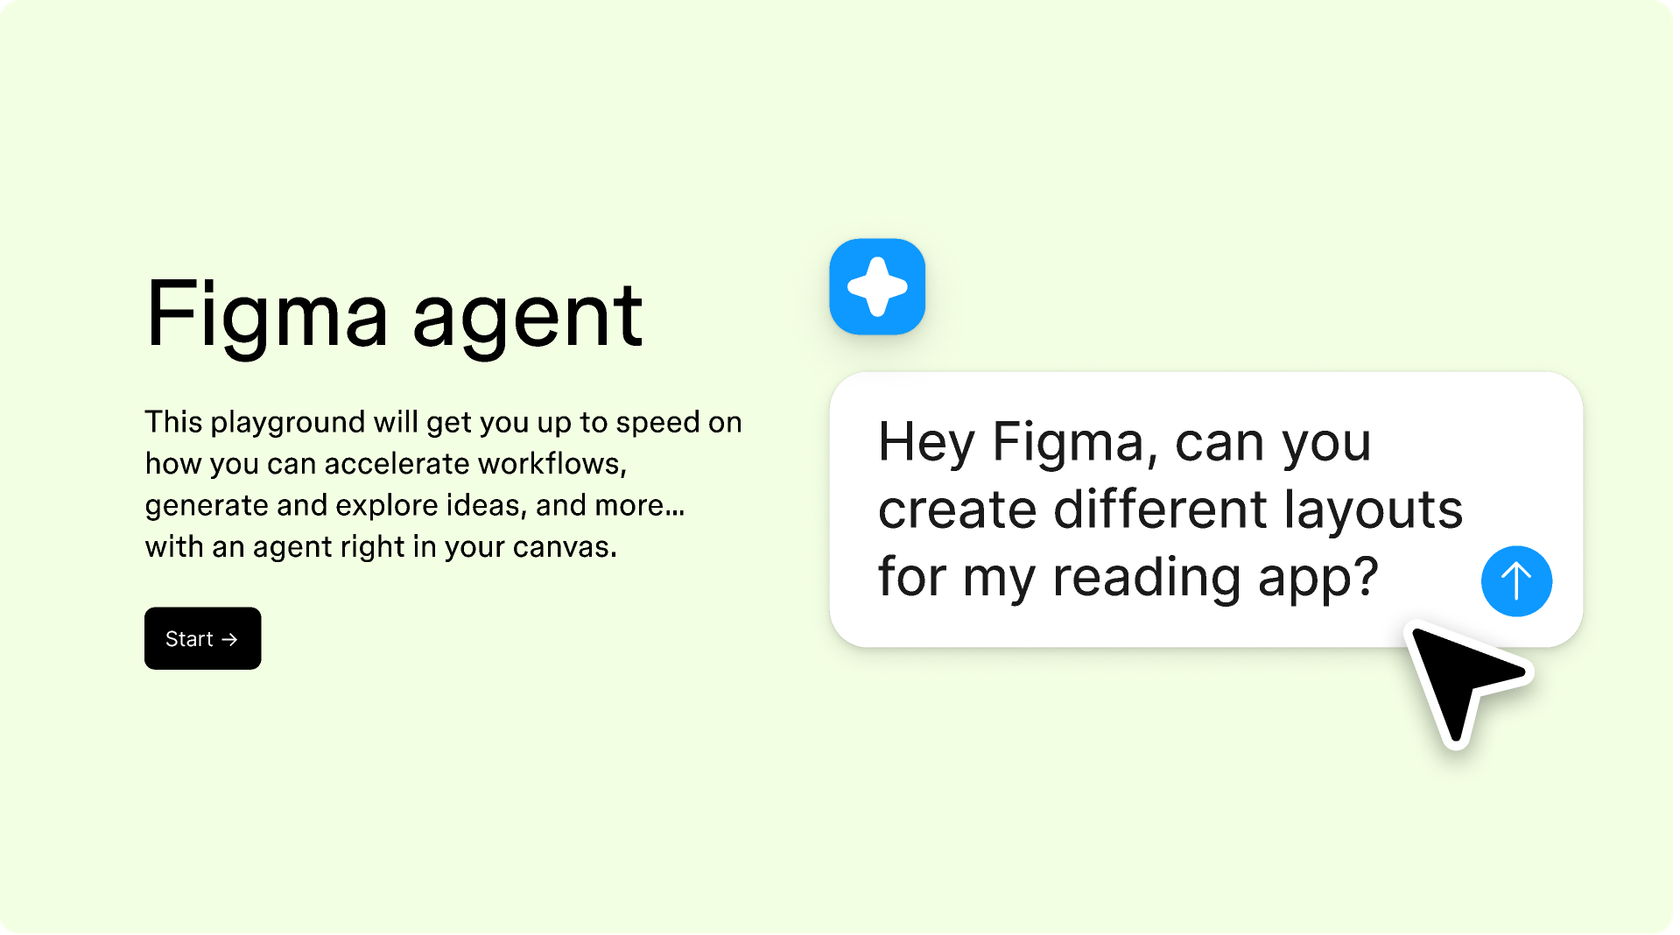
Hands-on playground to explore Figma agent's capabilities — from bulk edits to feedback implementation — with step-by-step guidance built right in.
Learn how to use Figma agent in your design workflows with a step-by-step tutorial from the Figma team.
A CSV to chart generator takes raw spreadsheet data and transforms it into visual charts—bar graphs, line charts, pie charts, and more. Figma's agent does this directly on the design canvas, creating editable chart components rather than static images. This means your data visualizations stay flexible and match your design system.
Drop your CSV onto the Figma Design canvas or paste the data into your prompt. Tell the agent what chart type you want and which data columns to visualize. The agent generates an editable chart using your design library's styles. You can refine it with follow-up prompts or adjust the layers by hand.
Figma's agent offers the most streamlined path from data to design. Instead of building charts in a separate tool and importing static images, you describe what you need and the agent generates editable charts on your canvas. This keeps your data visualizations in the same file as your designs, using your existing styles.
Figma's agent can generate common chart types including bar charts, line graphs, pie charts, and area charts from your CSV data. You can specify the chart type in your prompt, or ask the agent to recommend a visualization based on your data structure. Each chart generates as editable Figma layers.
Figma's agent is available on all paid Figma plans. You'll find it in the left navigation bar in Figma Design. During the current open beta, it doesn't consume AI credits—so it's a good time to explore, experiment, and share your feedback with us.
Build faster with Figma's agent


