

AI social media dashboard generator in Figma Make
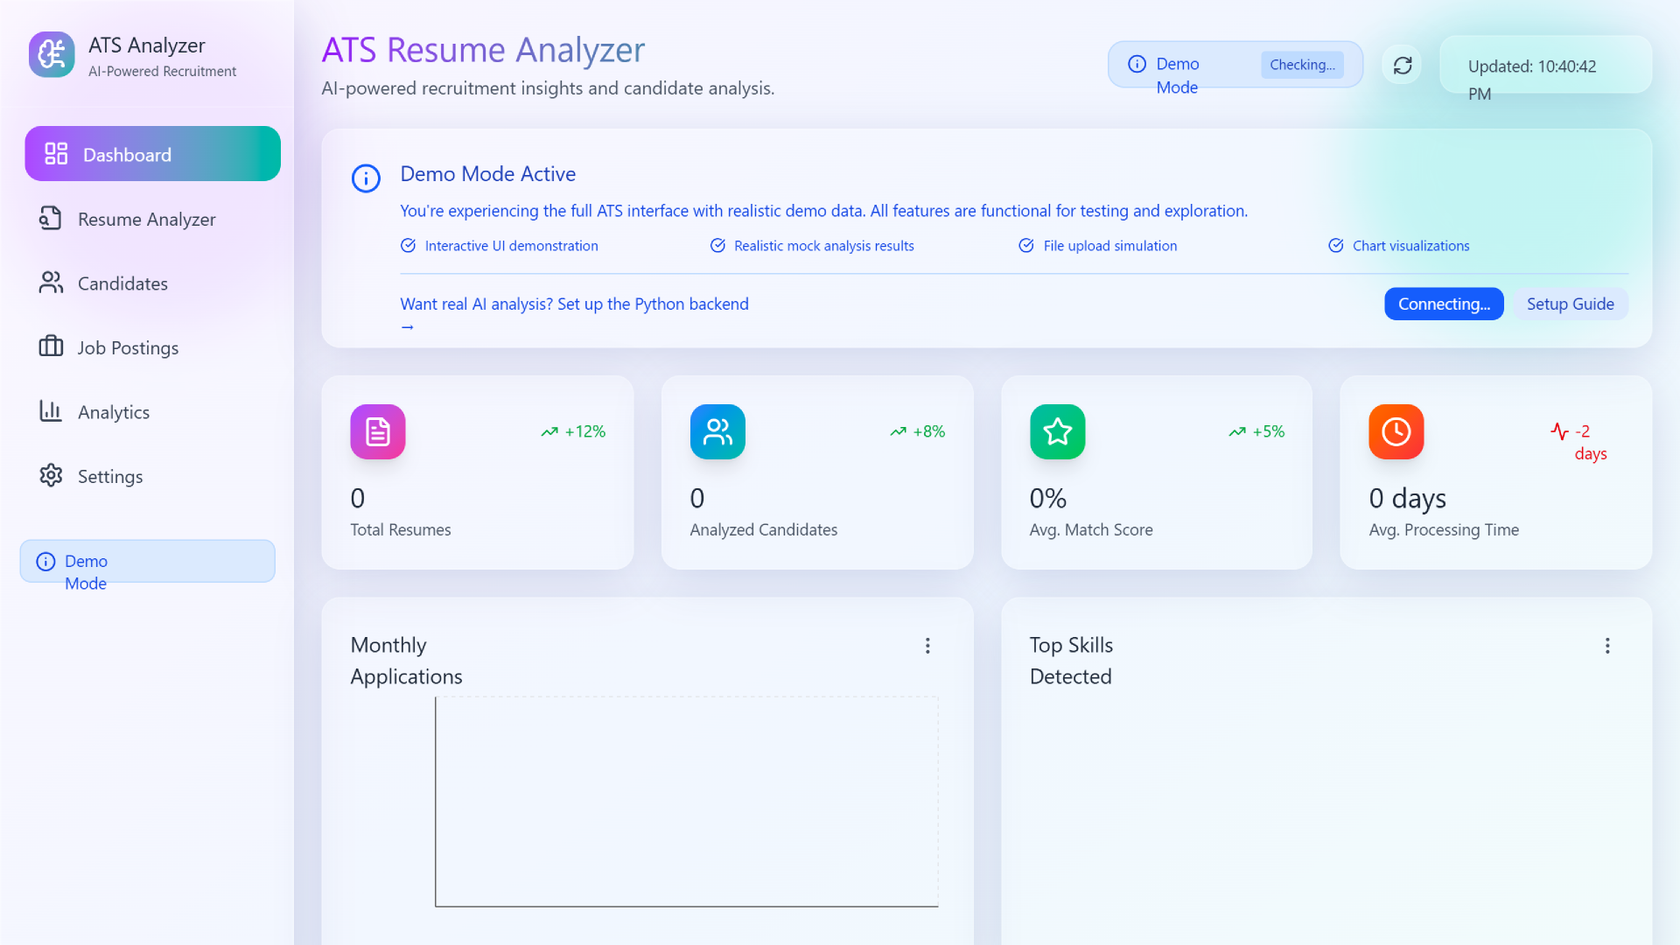
Go from idea to an interactive social analytics dashboard—powered by an AI social media dashboard generator that brings your concepts to life in seconds. Describe your layout, data sources, or behaviors, and watch your dashboard take shape, responsive and ready to test.
Design, prototype, and refine dashboards with an AI social media dashboard generator
Capture dashboard logic with a single prompt
Describe the SEO metrics you want to track—traffic trends, keyword rankings, conversions—and Figma Make builds a functional dashboard layout instantly.
Build on-brand dashboards using your design system
Use your existing components, tokens, and styles to generate dashboards that feel production-ready. Every chart, panel, and interaction stays aligned with your brand from the start.
Validate dashboards with real social data
Connect APIs or test with placeholder data to simulate real performance. Validate user flows and dashboard clarity with data that behaves like production.
Go from dashboard prototype to production
Export functional code aligned with your design system. Hand off experiences that match your dashboard’s structure and behavior so teams can ship faster with fewer iterations.
Built by real teams.
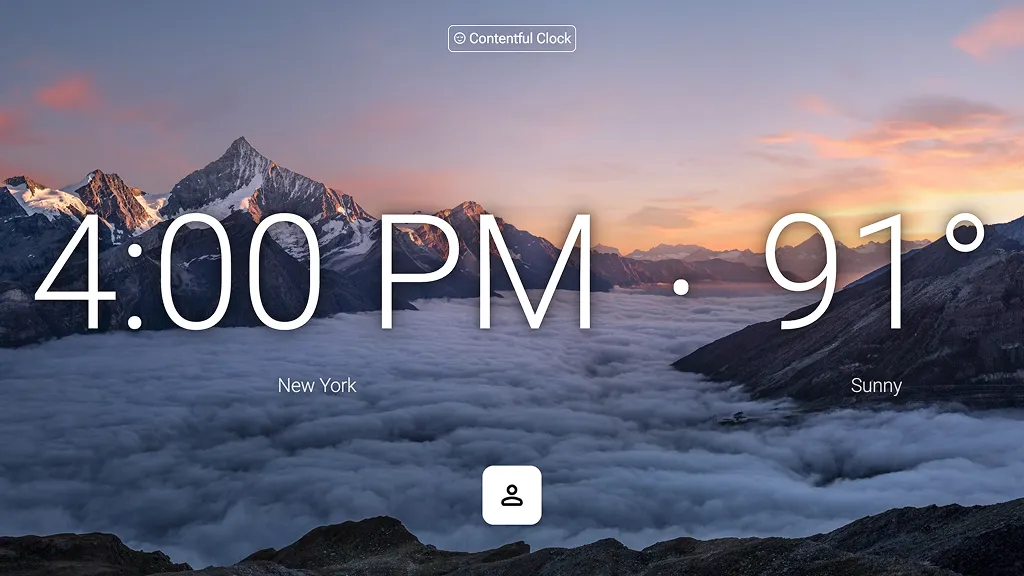
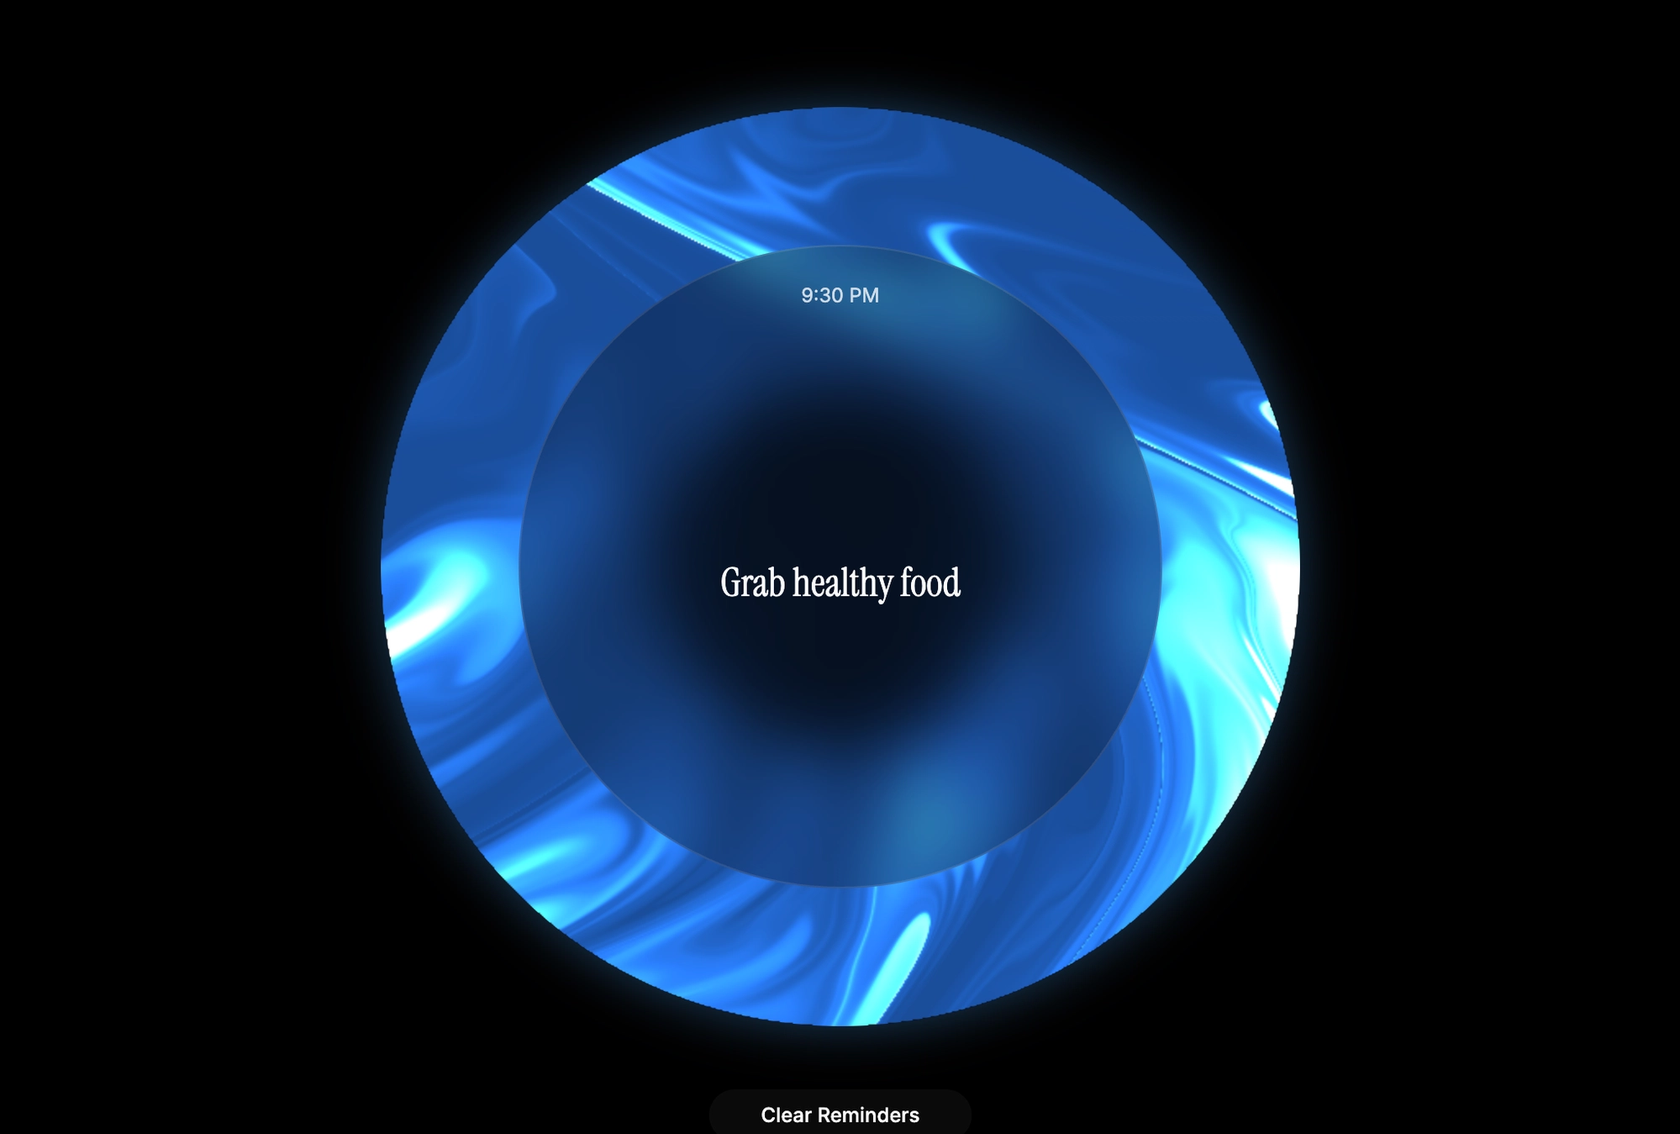
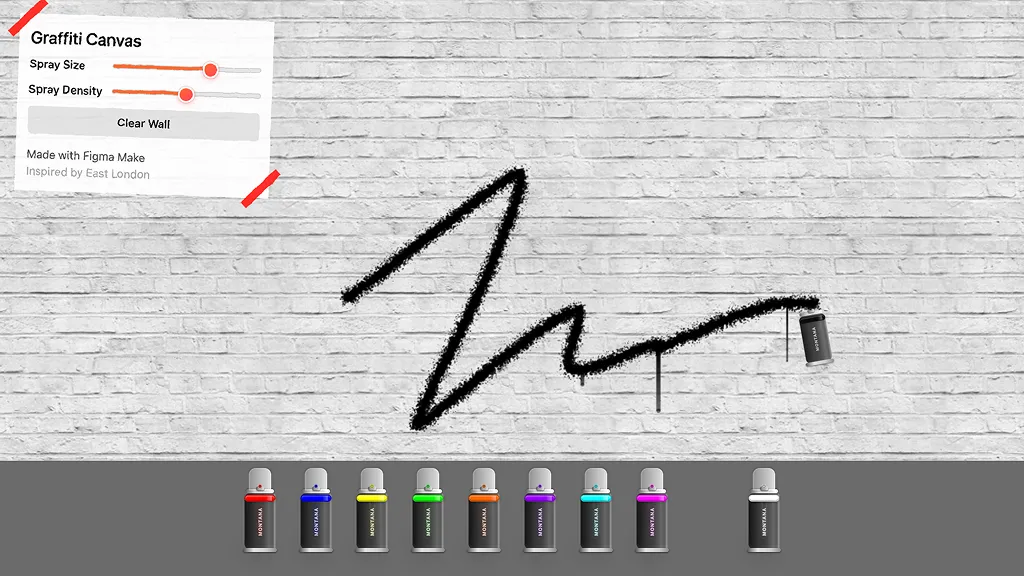
See how makers, designers, and PMs are using Figma Make to build no-code web apps—from internal tools to product MVPs.
- Jacques Debeuneure Jr.
- Daniela Muntyan

- kishoree04u

- Seungmee Lee







How to generate a social media dashboard in Figma Make
Begin with a blank frame in Figma Make or paste a frame from an existing Figma Design file.
Example prompt: “Create an empty dashboard layout frame for social analytics.”
Use natural language to prompt the metrics, layout, and interactions you want. Include filters, cards, charts, or user flows.
Example prompt: “Generate a social media dashboard showing follower growth, engagement rate, and a content performance table with filterable date ranges.”
Figma Make generates an interactive, responsive dashboard with editable components. You can preview interactions, states, and behaviors instantly.
Example prompt: “Add hover states to charts and make the filter dropdown interactive.”
Use additional prompts or adjust the design directly. Make updates layout, logic, and visuals while keeping everything editable.
Example prompt: “Move KPIs to the top row and style them using my design system tokens.”
FAQs
Yes. Figma Make supports backend integrations so dashboards can pull live or sample data. This enables realistic validation and more accurate user testing.
Absolutely. Users can copy components or frames from Figma Design, and Figma Make will generate dashboards using the team’s real design system—ensuring consistency throughout the prototype.
Yes. Dashboards can be published directly from Figma Make or shared with teammates for collaboration, review, and testing.
Figma Make turns prompts into structured flows, logic, and components, eliminating early planning overhead. Teams get shared clarity quickly, validate with real data, and export code aligned with production systems—accelerating the path from idea to shipped experience.
From the blog

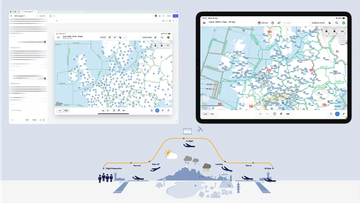
How Lufthansa Systems prototypes realistic maps for the cockpit with Figma Make
Pilots depend on in-flight software to navigate routes, see air traffic, avoid turbulence, and more. To bring more dynamic prototypes to user testing, Lufthansa Systems turned to Figma Make.
Create, ship, and manage data-backed websites with Payload in Figma
With Payload in Figma, teams can go from prototype to production together, managing their content and data all in one place.
Measuring time savings from Figma Make
The Figma Data Science team assumed that AI saves users time—but quantifying it required a new approach to research design.
A properties panel and annotations, now in Figma Make
With visual editing and annotations, Figma Make is bridging the gap between design and code. Select any element you want to change, adjust it directly in the properties panel, or write in-context prompts with annotations.
Workflow lab: Deploying designs directly with Figma Make
The handoff from design to code doesn't have to be a one-way street. This workflow shows how a designer can connect a codebase to Figma Make, make the changes directly, and bring the whole team into review—right up to the PR.

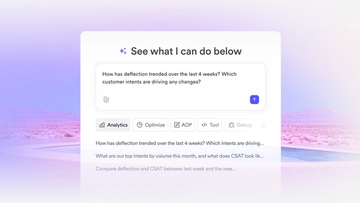
How Decagon uses AI for design system saturation
The fast-growing customer experience platform explains how Figma MCP and Figma Make helped them scale a new design system and keep pace with customer requests.
More resources

What is MCP?
Read articleLearn about Model Context Protocol (MCP), the open standard that simplifies AI integration like a USB-C for data.

What is Vibe coding?
Read articleVibe coding combines mood-driven design with seamless coding to create immersive digital experiences that connect emotionally and function flawlessly.


How to design an app in five steps
Read articleBuilding an app requires research and constant iteration to meet customer needs. Learn how to design an app and how Figma can help in this guide.