

Customer support dashboard generator in Figma Make
Go from idea to a fully interactive customer support dashboard—powered by an AI customer support dashboard generator that transforms prompts into layouts, logic, and real data connections.
Design customer support dashboards faster with AI
Turn support insights into interactive dashboards
Prompt once to generate layouts, charts, tables, and logic—perfect for visualizing response times, SLAs, or customer sentiment in seconds.
Build dashboards with natural language
Describe what you want to track—agent performance, resolution trends, queue health—and Figma Make assembles a ready-to-edit dashboard automatically.
Prototype with real support data
Connect APIs or datasets to preview dashboards with authentic values. Validate assumptions early with live metrics, not placeholders.
Use your design system for on-brand dashboards
Pull from your team’s components, tokens, and styles to ensure every chart, panel, and filter matches your product experience.
Built by real teams.
See how makers, designers, and PMs are using Figma Make to build no-code web apps—from internal tools to product MVPs.
- Jacques Debeuneure Jr.
- Daniela Muntyan

- kishoree04u

- Seungmee Lee







How to generate a customer support dashboard with Figma Make
Create a new frame in Figma Make or copy one from your existing design system. This will act as the foundation for your dashboard layout.
Use a natural language prompt to define the structure, metrics, and visualizations you want.
Example prompt: “Generate a customer support dashboard with charts for response time, open tickets by priority, agent performance, and customer satisfaction.”
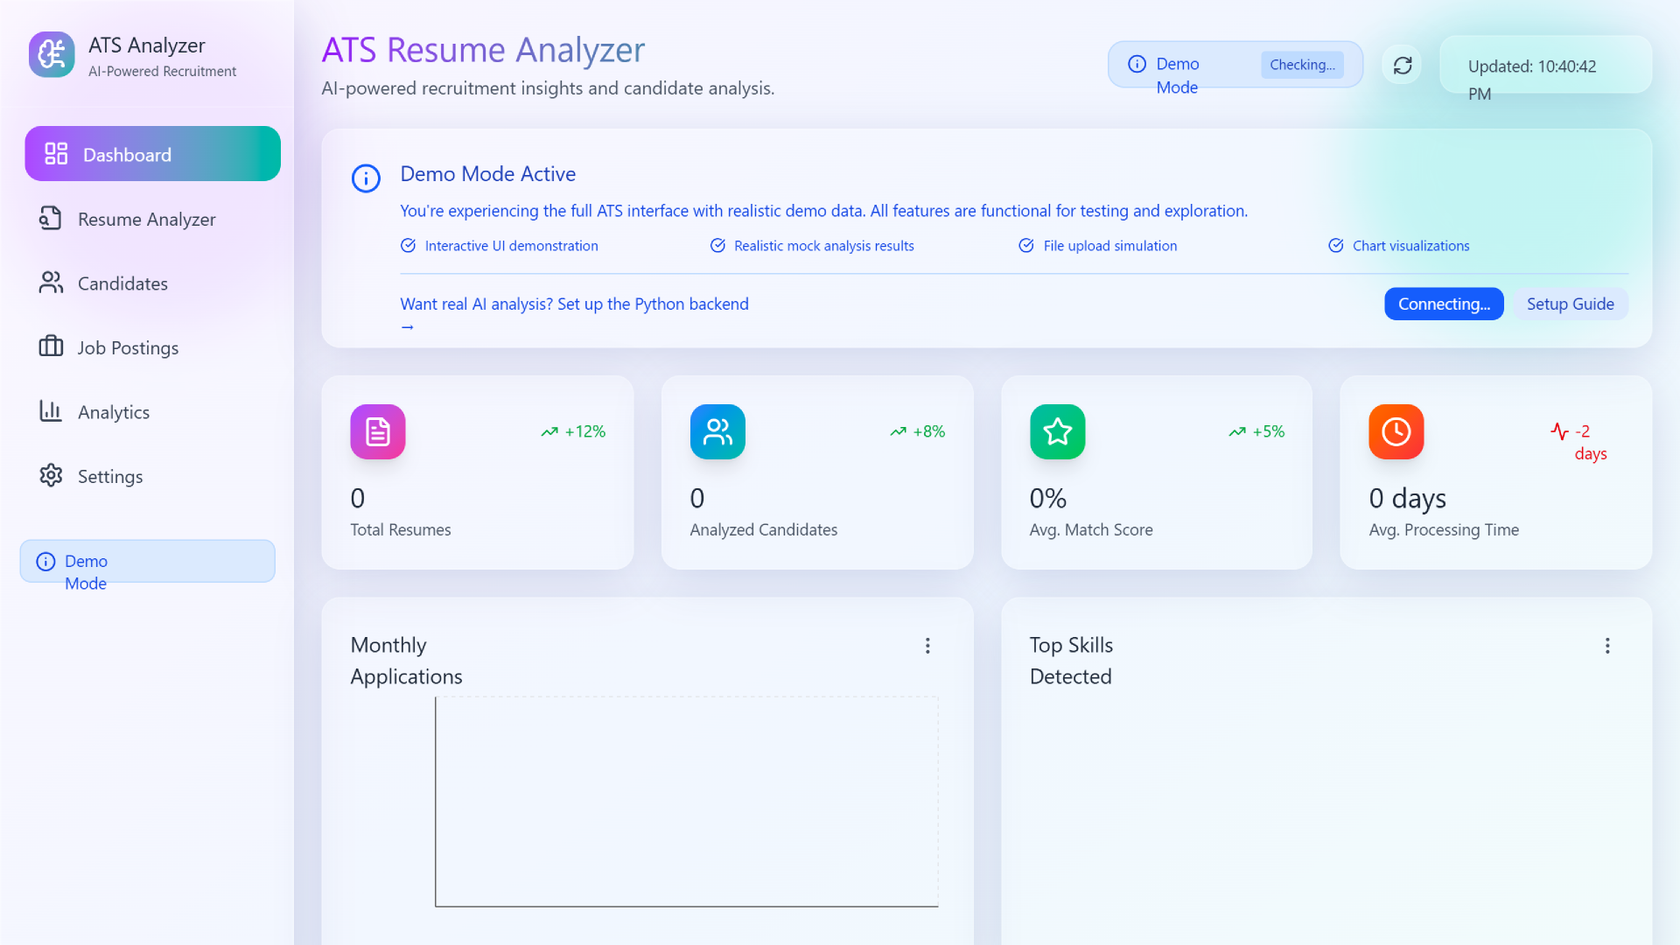
Figma Make builds an interactive dashboard with responsive layout, components, and logical data groupings—ready to test or refine.
Plug in your backend or sample API to power the dashboard with real values. Plug in live or sample datasets to preview real values. Adjust components manually or refine your dashboard through additional prompts.
Example prompt: “Add filtering for time range and agent groups and make the charts interactive.”
FAQs
It’s a tool that automatically builds functional dashboards from simple prompts. In Figma Make, you describe the metrics or layout you want, and AI designs a responsive, interactive dashboard you can test and refine.
Yes. Figma Make lets you connect APIs or backends so you can test dashboards with real customer data, ticket metrics, or live performance numbers.
No coding required. Prompts generate your layout, charts, and logic. However, developers can edit or export code if deeper customization is needed.
Absolutely. Copy frames, components, or libraries from Figma Design into Figma Make. Your dashboard will stay fully on-brand and system-aligned.
Everything from SLA tracking dashboards to queue monitoring, agent performance boards, feedback sentiment views, and multi-team reporting hubs.
Yes. You can share interactive prototypes or export production-ready code that aligns with your component library and engineering workflows.
From the blog

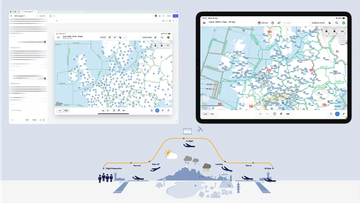
How Lufthansa Systems prototypes realistic maps for the cockpit with Figma Make
Pilots depend on in-flight software to navigate routes, see air traffic, avoid turbulence, and more. To bring more dynamic prototypes to user testing, Lufthansa Systems turned to Figma Make.
Create, ship, and manage data-backed websites with Payload in Figma
With Payload in Figma, teams can go from prototype to production together, managing their content and data all in one place.
Measuring time savings from Figma Make
The Figma Data Science team assumed that AI saves users time—but quantifying it required a new approach to research design.
A properties panel and annotations, now in Figma Make
With visual editing and annotations, Figma Make is bridging the gap between design and code. Select any element you want to change, adjust it directly in the properties panel, or write in-context prompts with annotations.
Workflow lab: Deploying designs directly with Figma Make
The handoff from design to code doesn't have to be a one-way street. This workflow shows how a designer can connect a codebase to Figma Make, make the changes directly, and bring the whole team into review—right up to the PR.

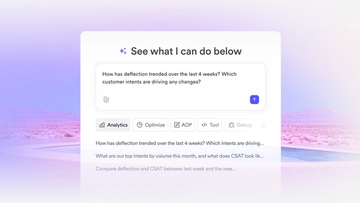
How Decagon uses AI for design system saturation
The fast-growing customer experience platform explains how Figma MCP and Figma Make helped them scale a new design system and keep pace with customer requests.
More resources

What is MCP?
Read articleLearn about Model Context Protocol (MCP), the open standard that simplifies AI integration like a USB-C for data.

What is Vibe coding?
Read articleVibe coding combines mood-driven design with seamless coding to create immersive digital experiences that connect emotionally and function flawlessly.


How to design an app in five steps
Read articleBuilding an app requires research and constant iteration to meet customer needs. Learn how to design an app and how Figma can help in this guide.